Milestone slip chart

July 31, 2010

This one of the most important chart a project manager has to maintain. Even if it appears to be complex it is very to built by applying a basic good practice.
For each project, first you have to define milestones and their corresponding target date. The table below defines several milestones for our projet.

In this table we have created four milestone with target dates. The title of the column “2/8/10” is simply the date of the first definition of the milestone date.
You have achieved the first step of the milestone slip chart.

If you define these dates at the beginning of the project without reevaluating them during the project you have an important risk of delay in your project.
So a good practice, is to reevaluate, for example each week, the target date of each milestone. Answer to the question, is the target date previously defined still reachable ? To log this evaluation you create a new column in your table like in the table below.

In the example above, on week later, there is no change for most of the milestones except for the milestone 2. Its target date, initially planned the 16/08, has move to the 23/08.
By performing the same exercise each week, you will obtain a full milestone table.

The last step is to draw a chart from these values.

With this graphical view, it is easy to identify quickly:
– milestones near from their target date: milestones that will soon cross the diagonal
– time lag: milestone trend not straight

A project well managed can have time lags but far from the diagonal. This means that the time lag has been anticipated. Like, in the example, the milestone 2.
A project not managed waits the target date to define a new date. In this case, the trend will almost reach the diagonal before defining a new date. Like, in the example, the milestone 3.


Value engineering

July 3, 2009

Last time, my family asked be for my favorites authors in order to make me a gift for my birthday. After an hard reflexion I was able to define a wish list but not to sort this list. What is the ranking between these authors, what are the books I want prior to others…

While thinking to this very important problem, I was remembering a method permitting to take a decision about complex problems by breaking them out into smaller ones easy to solve.

This method is part of the Value engineering and is usually used in IT domain during the Requirements development phase in order to sort requirements by priority. It is specially useful when it is not possible to obtain a consensus.

The method is quite simple:

  • Compare functions by pair and valuate the priority
    • 1: The function is a little more important than the other
    • 2: The function is more important than the other
    • 3: The function is much more important than the other
  • Sum the number of points obtained by each function
  • Compute the distribution of each function and draw a graph

To compare the functions, we will use a matrix . See what is the result with my favorites authors:

Image 1

To build the matrix I have compared each author one by one, starting at the top of the matrix. It is easy for me to take a decision between two authors:

  • Between Balzac and Bernanos, I prefer Bernanos (writting BER) a little, giving a 1 (writting 1)
  • Between Balzac and Boulgakov, I prefer Bernanos (writting BER) a little, giving a 1 (writting 1)
  • Between Balzac and Camus, I prefer Balzac (writting BAL) , giving a 2 (writting 2)

Performing the same comparison for each pair …

At the end of the comparison I make the sum of results obtained by each author and compute the distribution (result for the author on the sum of all results).

Here is the result:

Image 2

So according to this result, my favourites authors are: Conrad, Boulgakov, Bernanos, …

This very useful method permit to obtain a result that cannot be obtained in another way. This is simply done  by breaking a complex problem into several easy to solve comparison.
However, it is tedious to use with a great number of items.


Estimate of attributes

June 17, 2009
Establish Estimates of Work Product and Task Attributes

Establish Estimates of Work Product and Task Attributes

Once you have written the WBS, the next step consists in estimating the effort required to perform the described tasks. This is often done in two steps since it is not easy to determine directly the effort (or the cost) from the task.  The first step aims defining possible measures that will help in performing estimations during the second step. Typical measures often concern size. In the example initiated in a previous post, the major part of the work is to write a specification from a requirement document. The first measure that comes to mind is the number of pages. This is a possible measure but not enough detailed in our case.

Requirement documents are organized in requirements that have to be well defined, with an equivalent granularity level. Moreover, requirements are interesting because they lead the work. Once all requirements are treated , the work is finished. In consequence, requirements will be our main measure unit of the work to do.

Usually, requirements are easily identifiable since they have an ID compliant to a convention. For example requirements ID can be put between brackets, in this case a simple regexp tool can be used to count them (I’m writing a reminder to work on a post concerning requirement analysis).  This measure is a first level of measurement, it may be sufficient in most of the cases, however, the model can be refined by providing additional information like the complexity level of a requirement (simple, medium or complex). This additional information will permit to estimate more accurately the workload required to treat a requirement. A simple requirement will require less effort than a complex.

For other tasks of the WBS, measures have also to be defined. For all activities requiring meetings, the number of meeting is a good measure. Some activities directly linked to the writing can be deduced from the main task. For example, reviewing a document will be directly linked to the size of the document, itself being linked to the number of requirements. Finally, the cost of some tasks is equal whatever the amount of work produced. This is the case for deliveries. For these tasks, measure is not required if you already know the time it takes to deliver a document.

When defining measure, it is important to write not only the result obtained but the definition of the measure. The definition of the measure will be used as the base of the estimation hypothesis (my estimation is based on the number of requirements) and it will permit to analyze and refine estimations for next works. Establishing measures is an activity described in the Measurement and Analysis (MA) process of CMMI for Development.

Here is the result of a WBS sheet with measure definition:

WBS with measures

WBS with measures

The second step of the estimation process (using measures to deduce workload) will be treated in a next post.


WBS tools

June 14, 2009

To create a WBS, it can be interesting to use a Mind mapping software. Mind maps are diagrams used to represent information in a graphical structure called map. Softwares permit to create these diagrams. Several products exist in this category, like (see here for the full list):

  • XMind : Based on the Eclipse platform. This is the tool that has been used to produce diagrams of this post.
  • FreeMind: One of the first free mind mapping software (written in Java).

Since the WBS is a hierarchical structure, Mind mapping tools permits to represent and to design it efficiently. In consequence, it will be easy to:

  • Expand / Collapse level to show hide WBS detail
  • Reorder elements of the WBS (if an activity does not belong to a category, it is easy to move it with a Mind mapping software)
  • Add new elements, elements are easily inserted, numbering of existing elements is automatically computed
  • Add additional informations (notes, flags, etc.), Mind mapping softwares permit to add graphical elements in order to bring visual information.
  • Offer a global view of the project
  • Export the structure to a spreadsheet application for further use like estimating the WBS
  • And many other things, …

The following screen shots show what can be done in XMind with the example of the WBS presented in a previous post. All the views presented below have been created with the same structure, only the visual representation has been switched.

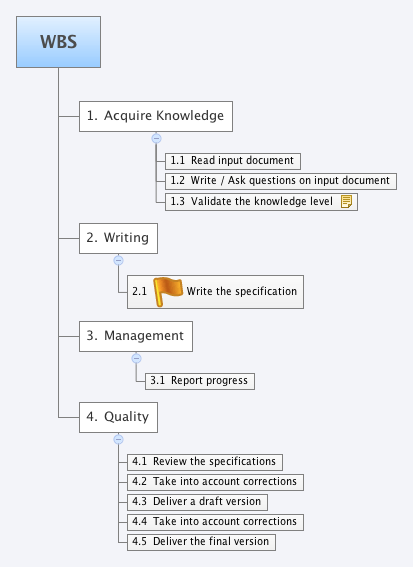
The standard map clockwise view (note: numbering function has been used in order to identify each activity of the WBS), this view is (most of the time) the default view of Mind mapping softwares:

WBS map view

WBS map view

The tree view, this is the standard view to represent a WBS:

WBS Tree structure

WBS Tree structure

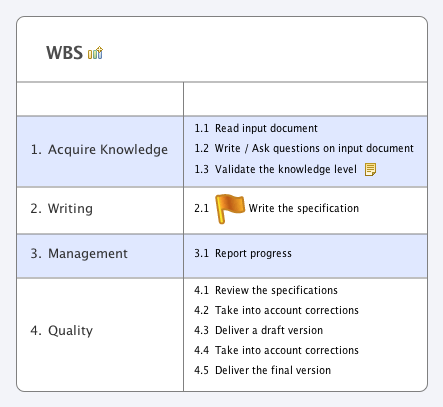
The spreadsheet view:

WBS spreadsheet view

WBS spreadsheet view

And, my favorite (it is the most funny) the fishbone view:

WBS fishbone

WBS fishbone


WBS

June 12, 2009

If you have a work to perform the first thing to do is to create a WBS. A WBS (Work Breakdown Structure) is the complex term for the list of tasks to perform in the frame of a project or a mission. For example, if you have to write a software specification based on a Requirement dossier, you have to define the list of tasks to perform in order to do the job.

Well writing this document will first require to read and understand the input document (the Requirement Dossier), this may require to run one or more workshops with customers to ask questions and acquire enough knowledge to be able to start writing the specifications. Once written, you will have to review yourself the document, perform corrections and finally deliverer it. During this work you will probably have to report the progress of your work to the customers and to your boss. In short, a lot of tasks aside the core task of writing the document.

This is the first benefit of using a WBS, it permits to make you think to the tasks you will have to perform. Without doing this inventory prior to the work start, tasks will be identified too late to have the time and the money to perform them properly.

Let’s write in a spreadsheet application the list of tasks to perform this job:

Initial WBS

Initial WBS

It is an interesting first step but, mainly two remarks can be made on this initial WBS:

  1. It does not define a hierarchical structure, it is hard to identify tasks since they are not categorized. Elements in this structure are called levels.
  2. The core task, “write the specification”, is not enough detailed. Performing this task encompasses a lot of activities. But, these activities are not known at this time. In consequence the WBS will be refined later.

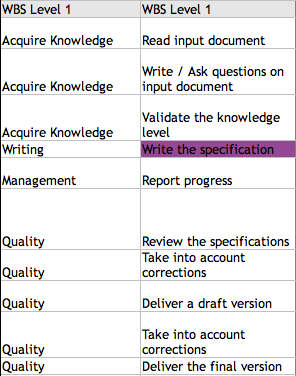
Here is the same WBS with the addition of top level categories.

Hirearchical WBS with 2 levels

Hirearchical WBS with 2 levels

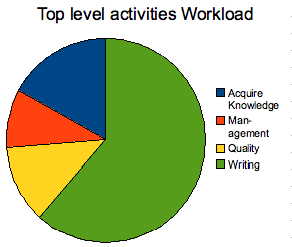
Besides the ergonomic enhancement, the categorization will permit to obtain, in the next estimation step, a model of this kind of work. It will permit to visualize, for example, the amount of additional workload required to perform the core task of writing a document. After several iterations, it will be the base of a model definition permitting to estimate accurately, from the workload required to write the document, the total workload required to perform the global process (writing the document + additional tasks).  The following pie chart gives an example of this kind of model:

pie chart of the workload by top level category

pie chart of the workload by top level category