If you have a work to perform the first thing to do is to create a WBS. A WBS (Work Breakdown Structure) is the complex term for the list of tasks to perform in the frame of a project or a mission. For example, if you have to write a software specification based on a Requirement dossier, you have to define the list of tasks to perform in order to do the job.
Well writing this document will first require to read and understand the input document (the Requirement Dossier), this may require to run one or more workshops with customers to ask questions and acquire enough knowledge to be able to start writing the specifications. Once written, you will have to review yourself the document, perform corrections and finally deliverer it. During this work you will probably have to report the progress of your work to the customers and to your boss. In short, a lot of tasks aside the core task of writing the document.
This is the first benefit of using a WBS, it permits to make you think to the tasks you will have to perform. Without doing this inventory prior to the work start, tasks will be identified too late to have the time and the money to perform them properly.
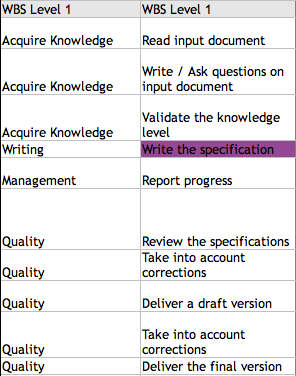
Let’s write in a spreadsheet application the list of tasks to perform this job:

Initial WBS
It is an interesting first step but, mainly two remarks can be made on this initial WBS:
- It does not define a hierarchical structure, it is hard to identify tasks since they are not categorized. Elements in this structure are called levels.
- The core task, “write the specification”, is not enough detailed. Performing this task encompasses a lot of activities. But, these activities are not known at this time. In consequence the WBS will be refined later.
Here is the same WBS with the addition of top level categories.

Hirearchical WBS with 2 levels
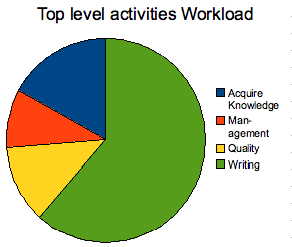
Besides the ergonomic enhancement, the categorization will permit to obtain, in the next estimation step, a model of this kind of work. It will permit to visualize, for example, the amount of additional workload required to perform the core task of writing a document. After several iterations, it will be the base of a model definition permitting to estimate accurately, from the workload required to write the document, the total workload required to perform the global process (writing the document + additional tasks). The following pie chart gives an example of this kind of model:

pie chart of the workload by top level category


 Posted by Romain